
Fall 2022
One of our two most-popular asset allocations is the 60% stock and 40% bond portfolio. Some clients who have achieved financial independence and are looking to take on less risk choose this portfolio as they head into retirement. For other clients who are still working, the risk-reward tradeoff of this conservative portfolio is like Goldilocks’ porridge selection—just right.
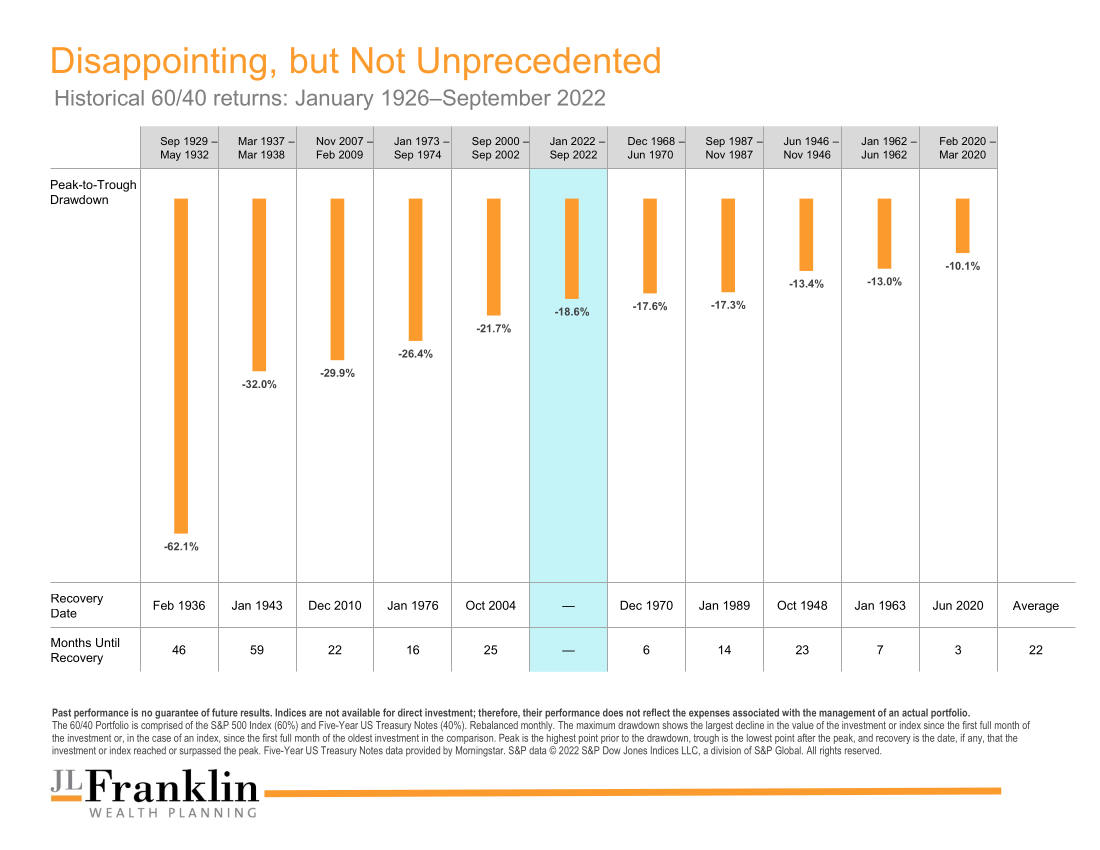
This year has been challenging for investors. On top of the equity bear market, the steep losses in bonds1 have been especially surprising, leading some investors to question whether the classic 60/40 portfolio is dead. Although 2022 has seen the worst start to a year in history for many bond indices2, the year-to-date experience for a 60/40 portfolio has not even dipped to the level of the worst five historical drawdowns of the last century. A 19% loss of wealth over nine months for a conservative investor can be stressful, but it’s only two-thirds of the drawdown investors endured through the financial crisis of 2008–2009 (see Exhibit 1).
Exhibit 1
A Case for Optimism
It is important, especially during difficult market conditions, for investors to refrain from focusing solely on where returns have been, but to think about where they could be going in the months and years ahead. Looking at the performance of a 60/40 portfolio following a decline of 10% or more since 1926 (see Exhibit 2), we see clearly that returns on average have been strong in the subsequent one-, three-, and five-year periods3. History makes a strong case for investors to stick with their longer-term plan and should help serve as a reminder that steep declines shouldn’t derail progress toward reaping the expected benefits of investing.
Exhibit 2
Roll with the Punches
Markets have proven quite resilient in the long run. Like a boxer stepping inside the ring, investors should expect (and mentally prepare) to absorb a few blows and get bruised every so often. The most important thing is to roll with the punches and not get knocked out by short-term moves. Taking action when the market is down is a quick way to derail your carefully constructed financial plan.
We believe the classic 60/40 portfolio is alive and well and could be poised to deliver healthy returns going forward.
Adapted from Dimensional, “The 60/40 Portfolio: Down but Not Out” by Alec Massino and Marlena Lee, October 20, 2022.
Footnotes
- Source: Morningstar Direct as of September 30, 2022.
- In USD. The 60/40 portfolio consists of the S&P 500 Index (60%) and five-year US Treasury notes (40%). Rebalanced monthly. Peak-to-trough drawdowns include all periods where the 60/40 portfolio declined by 10% or more from the prior peak. Peaks are defined as months where the 60/40 portfolio’s cumulative return exceeds all prior monthly observations. Troughs are defined as the months where the 60/40 portfolio’s cumulative return losses from the prior peak are the largest. Five-year US Treasury notes data provided by Morningstar. S&P data © 2022 S&P Dow Jones Indices LLC, a division of S&P Global. All rights reserved.
- Exhibit 2: In USD. The 60/40 portfolio consists of the S&P 500 Index (60%) and five-year US Treasury notes (40%). Rebalanced monthly. Drawdowns include all periods where the 60/40 portfolio declined by 10% or more from the prior peak. Peaks are defined as months where the 60/40 portfolio’s cumulative return exceeds all prior monthly observations. Returns are calculated for the one-, three-, and five-year look-ahead periods beginning the month after the 10% decline threshold is exceeded. The bar chart shows the average cumulative returns for the one-, three-, and five-year periods post decline. There are 10, nine, and nine observations for the one-, three-, and five-year look-ahead periods, respectively. Five-year US Treasury notes data provided by Morningstar. S&P data © 2022 S&P Dow Jones Indices LLC, a division of S&P Global. All rights reserved.
Disclosures
The information in this material is intended for the recipient’s background information and use only. It is provided in good faith and without any warranty or representation as to accuracy or completeness. Information and opinions presented in this material have been obtained or derived from sources believed by Dimensional to be reliable, and Dimensional has reasonable grounds to believe that all factual information herein is true as at the date of this material. It does not constitute investment advice, a recommendation, or an offer of any services or products for sale and is not intended to provide a sufficient basis on which to make an investment decision. Before acting on any information in this document, you should consider whether it is appropriate for your particular circumstances and, if appropriate, seek professional advice. It is the responsibility of any persons wishing to make a purchase to inform themselves of and observe all applicable laws and regulations.