Summer 2022
Investors can always expect uncertainty. While volatile periods like the one we’re experiencing now can be intense, investors who learn to embrace uncertainty may often triumph in the long run. Reacting to down markets is a good way to derail progress made toward reaching your financial goals.
Here are three lessons to keep in mind during periods of volatility that can help you stick to your well-built plan.
1. A recession is not a reason to sell
Are we headed into a recession? A century of economic cycles teaches us we may well be in one before economists make that call.
But one of the best predictors of the economy is the stock market itself. Markets tend to fall in advance of recessions and start climbing earlier than the economy does. As the below graphic shows, returns (the dark line) have often been positive while in a recession (the orange bars).
Figure 1
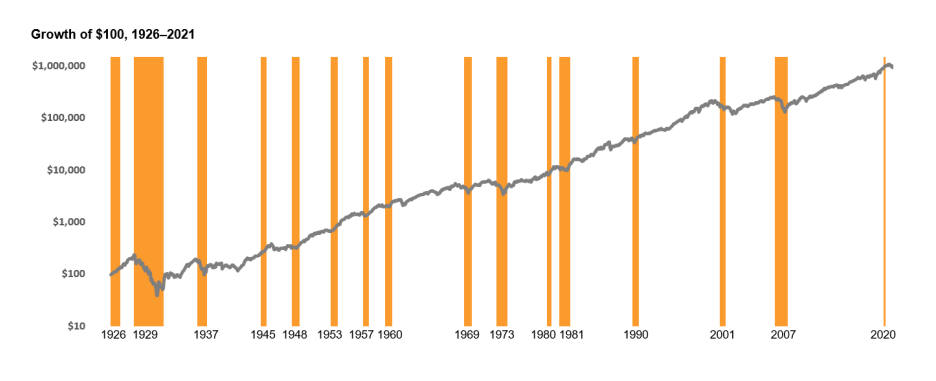
See Graphic Notes below.
All the dots in the upper left quadrant in the chart below are years when the US economy contracted but US stocks still outperformed less-risky Treasury bills. It’s a great illustration of the forward-looking nature of markets. If you’re worried, other investors are too, and that uncertainty is reflected in stock prices.
Figure 2

See Graphic Notes below.
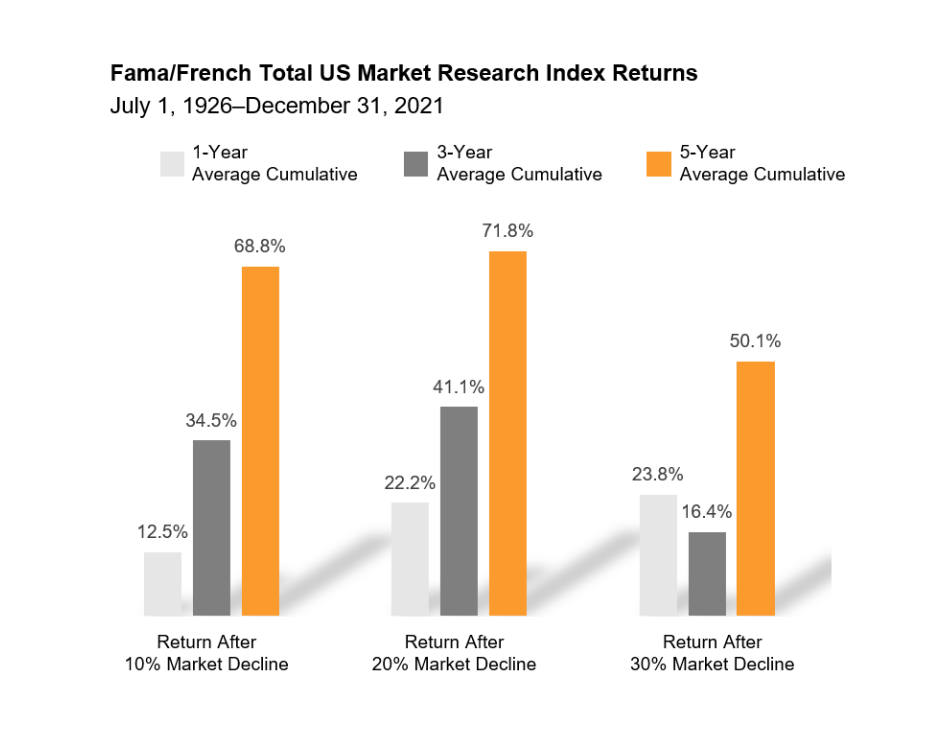
Whether accompanied by recessions or not, market downturns can be unsettling. But over the past century, US stocks have averaged positive returns over one-year, three-year, and five-year periods following a steep decline, as the graphic below shows.
One year after the S&P 500 crossed into bear market territory (a 20% fall from the market’s previous peak), it rebounded by about 20% on average. And after five years, the S&P 500 averaged returns over 70%.1
Figure 3
See Graphic Notes below.
We believe that staying invested puts you in the best position to capture the recovery. If you take risk out of your portfolio by selling, it should be a strategic, not tactical, choice. We believe the only good reason to sell out of a diversified, low-cost stock portfolio now is because you either changed your risk tolerance or your investment goals have changed.
2. Time the market at your peril
After stocks have declined, it might be tempting to sell to stem further losses. You might think, “I’ll sit out until things get a bit better.” But by the time markets are less volatile, you’ll have often missed a large part of the recovery and your long-term investment returns would have suffered. Yes, it stings to watch your portfolio shrink, but imagine how you’d feel if you were out of the market after it has rebounded.
Big return days are hard to predict, and you really don’t want to miss them. If you invested $1,000 in the S&P 500 continuously from the beginning of 1990 through the end of 2020, you would have $20,451. If you missed the single best day, you’d only have $18,329—and only $12,917 if you missed the best five days.2
History shows the stock market tends to rebound quickly. The same can’t be said for individual stocks or even entire sectors. So, while investing means taking on some risk for expected reward, investors should mitigate risks where they can. Diversification is a risk mitigation tool, along with investing in fixed income and having a financial plan.
3. Now may be a good time to reassess your portfolio and your plan
Baking banana bread and puppy adoption were fun fads in the early days of the pandemic.
Risk takers may have experimented with a pandemic investment fad, like FAANGs, meme stocks, or dogecoin; if this sounds like you, it may be time to take action to get your portfolio back in line.
- Do you know the names of all the stocks you own? If so, then you probably own too few.
- How much of your portfolio sits outside the US? Foreign stocks comprise about half of the global market. If you only invest in the S&P 500, you’re missing half of the world’s investment opportunity set. A market cap-weighted global portfolio is a better starting point than chasing segments of the market that have outperformed in the past few years.
If you want to outperform the market, allow decades of academic research to light the way. Portfolios focused on small caps, value stocks, and more profitable companies have had higher returns than large and growth stocks over the long run.
Beyond a well-designed portfolio, one of the best ways to deal with volatile markets and disappointing returns is to have planned for them. A financial advisor can help you develop a plan that bakes in the chances you’ll experience some market lows. And they can help you find the confidence to weather the current storm and get to the other side.
A sound approach to investing—through a financial plan, a well-designed portfolio, and an advisor—is the ultimate self-care during these rough markets. Your future self will thank you.
Adapted from “Three Crucial Lessons for Weathering the Stock Market’s Storm,” by Marlena Lee PhD; the piece first appeared in MarketWatch with the title “Follow these 3 crucial lessons for weathering the stock market’s storm.”
Footnotes
- S&P data © 2022 S&P Dow Jones Indices LLC, a division of S&P Global. All rights reserved. Indices are not available for direct investment.
- Past performance, including hypothetical performance, is no guarantee of future results. Growth of $1,000 is hypothetical and assumes reinvestment of income and no transaction costs or taxes. The analysis is for illustrative purposes only and is not indicative of any investment. S&P data © 2022 S&P Dow Jones Indices LLC, a division of S&P Global. All rights reserved. Indices are not available for direct investment.
Graphic Notes
Past performance is no guarantee of future results.
Figure 1 In US dollars. Recessions shaded in orange. Stock returns represented by Fama/French Total US Market Research Index, provided by Ken French and available at mba.tuck.dartmouth.edu/pages/faculty/ken.french/data_library.html. This value-weighed US market index is constructed every month, using all issues listed on the NYSE, AMEX, or Nasdaq with available outstanding shares and valid prices for that month and the month before. Exclusions: American depositary receipts. Sources: CRSP for value-weighted US market return. Rebalancing: Monthly. Dividends: Reinvested in the paying company until the portfolio is rebalanced. Growth of wealth shows the growth of a hypothetical investment of $100 in the securities in the Fama/French US Total Market Research Index from July 1926 through December 2021.
Figure 2 Indices are not available for direct investment. Their performance does not reflect the expenses associated with the management of an actual portfolio. In USD. Annual GDP growth rates obtained from the US Bureau of Economic Analysis. GDP growth numbers are adjusted to 2012 USD terms to remove the effects of inflation. Data provided by Fama/French. Results shown during periods prior to each index’s index inception date do not represent actual returns of the respective index. Other periods selected may have different results, including losses. Backtested index performance is hypothetical and is provided for informational purposes only to indicate historical performance had the index been calculated over the relevant time periods. Backtested performance results assume the reinvestment of dividends and capital gains.
Figure 3 Market declines or downturns are defined as periods in which the cumulative return from a peak is -10%, -20%, or -30% or lower. Returns are calculated for the 1-, 3-, and 5-year look-ahead periods beginning the day after the respective downturn thresholds of -10%, -20%, or -30% are exceeded. The bar chart shows the average returns for the 1-, 3-, and 5-year periods following the 10%, 20%, and 30% thresholds. For the 10% threshold, there are 29 observations for 1-year look-ahead, 28 observations for 3-year look-ahead, and 27 observations for 5-year look-ahead. For the 20% threshold, there are 15 observations for 1-year look-ahead, 14 observations for 3-year look-ahead, and 13 observations for 5-year look-ahead. For the 30% threshold, there are 7 observations for 1-year look-ahead, 6 observations for 3-year look-ahead, and 6 observations for 5-year look-ahead. Peak is a new all-time high prior to a downturn. Source: Ken French website.
Additional Notes
The information in this material is intended for the recipient’s background information and use only. It is provided in good faith and without any warranty or representation as to accuracy or completeness. Information and opinions presented in this material have been obtained or derived from sources believed to be reliable and we have reasonable grounds to believe that all factual information herein is true as at the date of this material. It does not constitute investment advice, recommendation, or an offer of any services or products for sale and is not intended to provide a sufficient basis on which to make an investment decision. Before acting on any information in this document, you should consider whether it is suitable for your particular circumstances and, if appropriate, seek professional advice. It is the responsibility of any persons wishing to make a purchase to inform themselves of and observe all applicable laws and regulations. Unauthorized reproduction or transmitting of this material is strictly prohibited.
Diversification neither assures a profit nor guarantees against loss in a declining market. Investments involve risks. The investment return and principal value of an investment may fluctuate so that an investor’s shares, when redeemed, may be worth more or less than their original value.