
Fall 2019
It’s not unusual for the stock market to be a topic of conversation at holiday get-togethers and other social gatherings.
A neighbor or relative might ask about which investments are good at the moment. The lure of getting in at the right time or avoiding the next downturn can tempt even disciplined, long-term investors. The reality of successfully timing markets, however, is much more complicated than it sounds.
OUTGUESSING THE MARKET IS DIFFICULT
Attempting to buy individual stocks or make tactical asset allocation changes at exactly the “right” time is challenging, to put it mildly. First and foremost, markets are fiercely competitive and adept at processing information. During 2018, an average of $462.8 billion in equity trading took place around the world daily.1 The combined effect of all this buying and selling is that available information, from economic data to investor preferences and so on, is quickly incorporated into market prices. If you’re trying to time the market based on an article you read online this morning or a segment you caught on CNBC, it’s likely that information is already reflected in prices by the time you can trade on it.
Dimensional recently studied the performance of actively managed U.S.-based mutual funds and found that even professional investors have difficulty beating the market: Among funds that did not close or merge with another fund over the last 20 years, 77% of equity funds and 92% of fixed income funds did not outperform their benchmarks after costs.2
Further complicating matters, for investors to have a shot at successfully timing the market, they must make the call to buy or sell stocks correctly not just once, but twice. Nobel Laureate Robert Merton said it well in a recent interview with Dimensional:
“Timing markets is the dream of everybody. Suppose I could verify that I’m a .700 hitter in calling market turns. That’s pretty good; you’d hire me right away. But to be a good market timer, you’ve got to do it twice. What if the chances of me getting it right were independent each time? They’re not. But if they were, that’s 0.7 times 0.7. That’s less than 50-50. So, market timing is horribly difficult to do.”
TIME AND THE MARKET
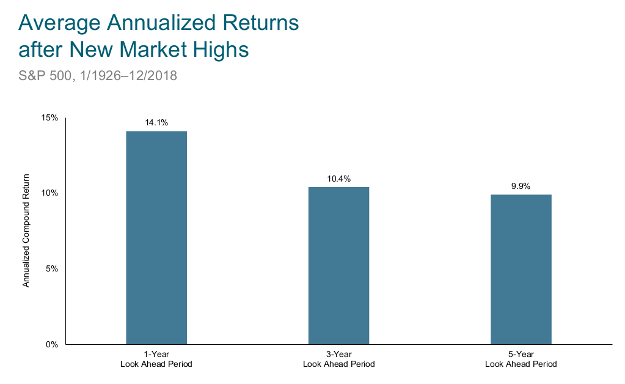
The S&P 500 Index has logged an incredible decade. Should this result impact investors’ allocations to equities? Exhibit 1 suggests that new market highs have not been a harbinger of negative returns to come. The S&P 500 went on to provide positive average annualized returns over one, three, and five years following new market highs.
Exhibit 1. Average Annualized Returns
See Footnote 3
CONCLUSION
Outguessing markets is more difficult than many investors think. While favorable timing is possible, in theory, we don’t have much evidence that it can be done reliably, even by professional investors.
The good news is that investors don’t need to be able to time markets to benefit. Over time, capital markets have rewarded investors who have taken a long-term perspective and remained disciplined in the face of short-term noise. By focusing on the things they can control—appropriate asset allocation, diversification, and managing expenses, turnover, and taxes—investors can better position themselves to make the most of capital markets.
Footnotes
- In U.S. dollars. Source: Dimensional, using data from Bloomberg LP. Includes primary and secondary exchange trading volume globally for equities. ETFs and funds are excluded. Daily averages were computed by calculating the trading volume of each stock daily as the closing price multiplied by shares traded that day. All such trading volume is summed up and divided by 252 as an approximate number of annual trading days.
- Past performance is no guarantee of future results. U.S.-domiciled open-end mutual fund data is from Morningstar. The sample includes funds at the beginning of the 20-year period ending December 31, 2018.
- In U.S. dollars. Past performance is no guarantee of future results. New market highs are defined as months ending with the market above all previous levels for the sample period. Annualized compound returns are computed for the relevant time periods subsequent to new market highs and averaged across all new market high observations. There were 1,115 observation months in the sample. January 1990–December 2018: S&P 500 Total Returns Index. S&P data © 2019 S&P Dow Jones Indices LLC, a division of S&P Global. All rights reserved. January 1926–December 1989; S&P 500 Total Return Index, Stocks, Bonds, Bills and Inflation Yearbook™, Ibbotson Associates, Chicago. For illustrative purposes only. Index is not available for direct investment; therefore, its performance does not reflect the expenses associated with the management of an actual portfolio. There is always a risk that an investor may lose money.