Fall 2017
David Booth, the Founder and Executive Chairman of Dimensional Fund Advisors, once said: “I have found that the importance of having an investment philosophy—one that is robust and that you can stick with— cannot be overstated.”
This quote is simple, yet powerful. The U.S. stock market has delivered an average annual return of approximately 10% since 1926.1 But short-term results vary, and in any given period stock returns can be positive, negative, or flat. When setting expectations, it’s helpful to see the range of historical outcomes. Can you guess how often the stock market’s annual returns actually aligned with its long-term average?
Exhibit 1 shows calendar year returns for the S&P 500 Index since 1926. The shaded band marks the historical average of 10%, plus or minus 2 percentage points. The S&P 500 had a return within this range in only six of the past 91 calendar years. This is extraordinary. In most years the index’s return was outside of the range, often above or below by a wide margin, with no obvious pattern. For investors, this data highlights the importance of looking beyond average returns and being aware of the range of potential outcomes.
S&P 500 Index Annual Returns
1926–2016
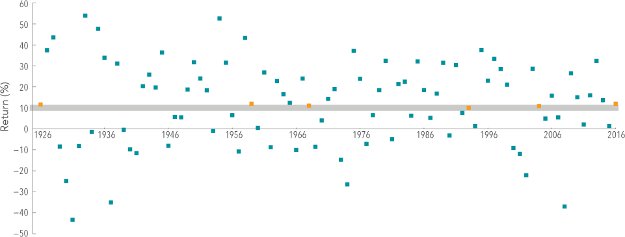
In U.S. dollars. The S&P data are provided by Standard & Poor’s Index Services Group. Indices are not available for direct investment; therefore, their performance does not reflect the expenses associated with the management of an actual portfolio. Past performance is not a guarantee of future results. Index returns do not reflect the cost associated with an actual investment.
1. As measured by the S&P 500 Index from 1926–2016.
Stay Invested to Stay Positive
Despite the year-to-year uncertainty, investors can potentially increase their chances of having a positive outcome by maintaining a long-term focus. Exhibit 2 documents the historical frequency of positive returns in the U.S. market over rolling periods of one, five, 10, and 15 years. The data shows that while positive performance is never assured, investors’ odds improve over longer time horizons.
Frequency of Positive Returns in the S&P 500 Index
Overlapping Periods: 1926–2016
From January 1926–December 2016, there are 913 overlapping 15-year periods, 973 overlapping 10-year periods, 1,033 overlapping 5-year periods, and 1,081 overlapping 1-year periods. The first period starts in January 1926, the second period starts in February 1926, the third in March 1926, and so on. In U.S. dollars. The S&P data are provided by Standard & Poor’s Index Services Group. Indices are not available for direct investment; therefore, their performance does not reflect the expenses associated with the management of an actual portfolio. Past performance is not an indication of future results.
Stick with Your Plan
While some investors might find it easy to stay the course in years with above average returns, periods of disappointing results may test their faith in equity markets. Being aware of the range of potential outcomes can help you remain disciplined, which in the long term can increase the odds of a successful investment experience. To endure the ups and downs of the stock market, it helps to have an understanding of how markets work and to trust market prices. An asset allocation that aligns with your personal risk tolerance and investment goals is also valuable.
A personal financial advisor can play a critical role in helping you sort through these and other issues while keeping you focused on your long‑term goals.
With thanks to Dimensional Fund Advisors LP.