Spring 2019
A recent Wall Street Journal article, “Time to Scrap ‘Emerging Markets’?” makes a case against investing in high-risk/high-yield markets. The author argues markets that are considered emerging have grown to the point that they match – and sometimes surpass – the economies in developed nations, and that the difference in returns between equities in emerging and developed nations is so small that the diversification benefits of investing in emerging markets are diminished. You should not use a market’s classification as emerging or developed, the author claims, to determine how much of your portfolio is made up of assets from that market.
We disagree.
Below are some reasons why we believe emerging markets remain an important slice of a globally diversified portfolio.
- Emerging markets make up about 12% of global market cap weight. See Exhibit 1, Market Capitalization of Global Stock Markets, below.
Exhibit 1. Market Capitalization of Global Stock Markets
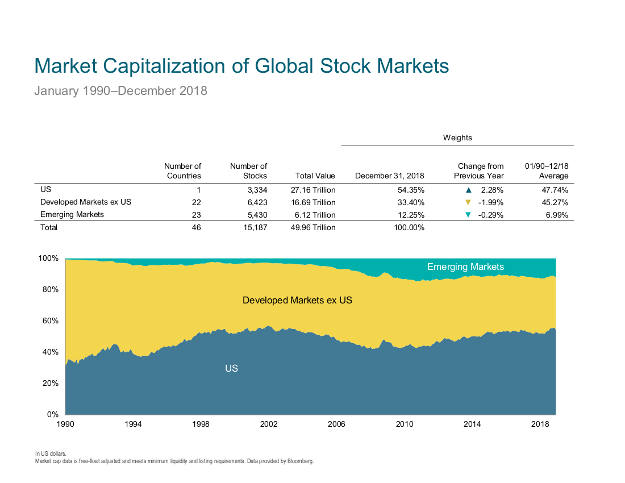
See footnotes, below.
- The Wall Street Journal article talks about China dominating the Morgan Stanley Capital International Emerging Markets index. While this is true, our favorite emerging markets fund (from Dimensional) places a 17.5% country cap on any individual country because they don’t want too much country-specific risk, per a statement released on the firm’s website. Currently, China is the only country that surpasses this cap weight, and as a result Dimensional distributes the rest of the portfolio somewhat pro-rata across the other countries.
- We view emerging markets as having a higher expected return relative to developed markets because of the greater exposure to political and economic risk in financial markets. In a 2015 white paper, Dimensional looked at Economic Freedom rankings (property rights, freedom from corruption, monetary freedom, trade freedom, etc.) to examine the risks in emerging market countries. In reality, country classification is a continuum (nothing is ever black or white), and having a truly global allocation allows for a more effective means for managing country-, sector-, and security-specific risk, and allows a broader opportunity set to pursue size, value, and profitability premiums.
Recent under-performance versus U.S. stocks calls into question if an emerging market allocation still belongs in the portfolio. We believe lack of correlation with developed markets is an important reason to hold emerging markets. Developed markets and emerging markets equities do not move in tandem. For example, in the period between January 2000 and December 2009, the S&P 500 Index had a loss of 9%, but emerging markets equities had a total return of 183%. See Exhibit 2, A Look Beyond Large Cap Developed Equity Markets, below.
Exhibit 2. A Look Beyond Large Cap Developed Equity Markets
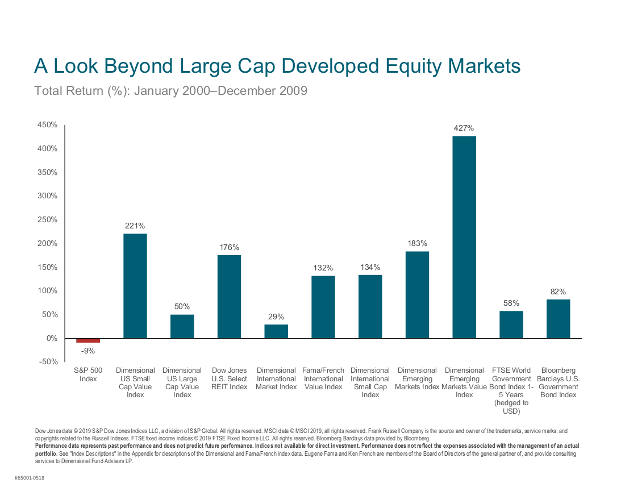
See footnotes, below.
Time period matters. Look at the annual returns for various asset classes over the past 15 years in the chart below. From 2004 through 2018, emerging markets have seen both positive and negative annual returns without any discernable pattern based on how the other asset classes perform. This further points to a lack of correlation between emerging markets and developed markets, and leads to situations like that in 2007, in which emerging markets had an annual return of over 39% while the second-best performing equity class, international large cap value, had a return of less than 8%. See Exhibit 3, The Randomness of Returns, below.
Exhibit 3. The Randomness of Returns

See footnotes, below.
We strongly believe that emerging markets equities have an important place in a globally diversified portfolio.
Footnotes
Exhibit 1. Market Capitalization of Global Stock Markets
In US dollars. Market cap data is free-float adjusted and meets minimum liquidity and listing requirements. Data provided by Bloomberg.
Exhibit 2. A Look Beyond Large Cap Developed Equity Markets
Dow Jones data © 2019 S&P Dow Jones Indices LLC, a division of S&P Global. All rights reserved. MSCI data © MSCI 2019, all rights reserved. Frank Russell Company is the source and owner of the trademarks, service marks, and copyrights related to the Russell Indexes. FTSE fixed income indices © 2019 FTSE Fixed Income LLC. All rights reserved. Bloomberg Barclays data provided by Bloomberg.
Performance data represents past performance and does not predict future performance. Indices not available for direct investment. Performance does not reflect the expenses associated with the management of an actual portfolio. See “Index Descriptions” in the Appendix for descriptions of the Dimensional and Fama/French index data. Eugene Fama and Ken French are members of the Board of Directors of the general partner of, and provide consulting services to Dimensional Fund Advisors LP.
Exhibit 3. The Randomness of Returns
In US dollars. US Large Cap is the S&P 500 Index, data © 2019 S&P Dow Jones Indices LLC, a division of S&P Global. All rights reserved. US Large Cap Value is the Russell 1000 Value Index. US Small Cap is the Russell 2000 Index. US Small Cap Value is the Russell 2000 Value Index. Frank Russell Company is the source and owner of the trademarks, service marks, and copyrights related to the Russell Indexes. US Real Estate is the Dow Jones US Select REIT Index, data © 2019 S&P Dow Jones Indices LLC, a division of S&P Global. All rights reserved. International Large Cap Value is the MSCI World ex USA Large Cap Value Index (gross div.). International Small Cap is the MSCI World ex USA Small Cap Index (gross dividends). International Small Cap Value is the MSCI World ex USA Small Cap Value Index (gross dividends). Emerging Markets is the MSCI Emerging Markets Index (gross dividends). MSCI data © MSCI 2019, all rights reserved. One-Year US Fixed is the ICE BofAML One-Year US Treasury Note Index, ICE BofAML index data © 2019 ICE Data Indices, LLC. Five-Year US Government Fixed is the Bloomberg Barclays Treasury Bond Index 1–5 Years. Bloomberg Barclays data provided by Bloomberg. Five-Year Global Fixed is the FTSE World Government Bond Index 1-5 Years (hedged to USD), © 2019 by FTSE Fixed Income LLC. Indices are not available for direct investment. Their performance does not reflect the expenses associated with the management of an actual portfolio. Past performance is not a guarantee of future results. Indexes are not available for direct investment. Index performance does not reflect the expenses associated with the management of an actual portfolio. Past performance is not a guarantee of future results.