
Winter 2024
The major market indices of US stocks, international developed equities, emerging markets, global real estate, and both US and global bonds had strong positive returns for the fourth quarter of 2023. This was a sharp reversal from the third quarter when each of these asset classes clocked negative returns.
For the past one, five, and 10 years, all major market indexes had positive returns. For the one-year period ending December 31, 2023, both the US stock market and international developed stocks returned over 18%. For the same period, bonds, which we expect to dampen volatility but not return anywhere near stocks, returned 5.5 and 8.3% for US bonds and global bonds, respectively.
The takeaway is that if you can stomach the daily and quarterly volatility that comes with holding stocks, that’s the place to earn the highest returns over the long term.
Selected Headlines from the Past 12 Months Graphed with the World Stock Market Performance (MSCI All Country World Index)
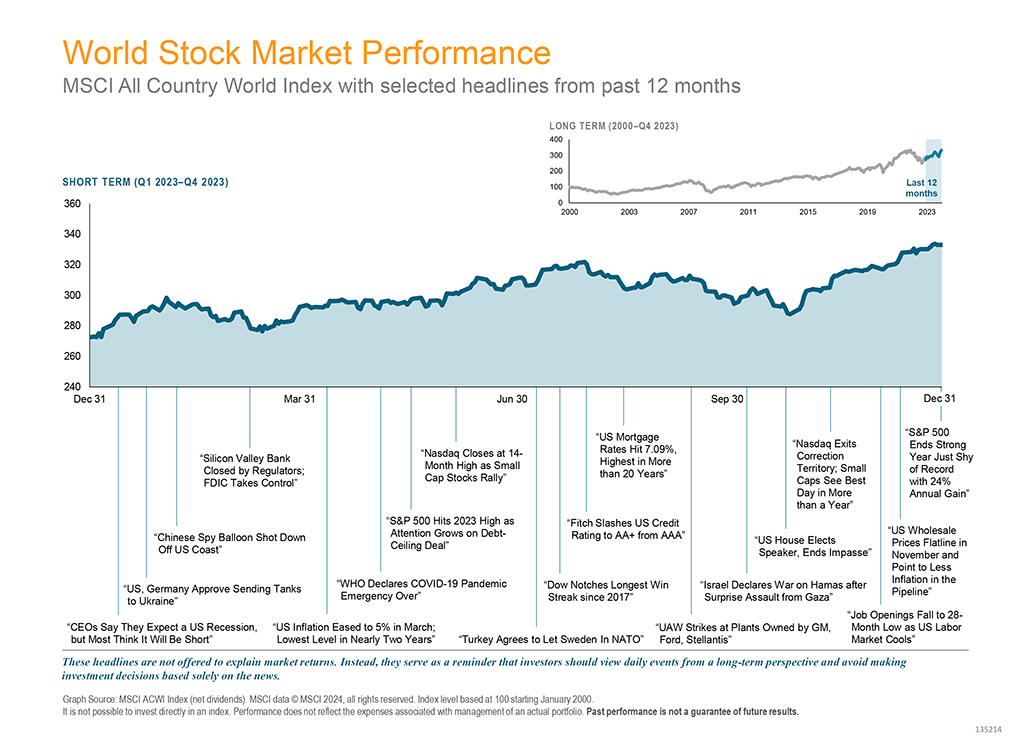
The chart above highlights some of the year’s prominent headlines in the context of global stock market performance as measured by the MSCI All Country World Index-Investable Market Index (MSCI ACWI IMI). We are not offering these headlines to explain market returns. But they do serve as a reminder that investors should view daily events from a long-term perspective and avoid making financial decisions based solely on the news.
Investment Review
| Benchmark Funds | Q4 2023 | 12 Months Ending 12/31/2023 |
| US Large Cap Vanguard 500 Index Fund |
11.7% |
26.2% |
| US Large Cap Value iShares Russell 1000 Value Index |
9.5% |
11.4% |
| US Small Cap iShares Russell 2000 Index |
14.0% |
16.8% |
| US Small Cap Value iShares Russell 2000 Value Index |
15.3% |
14.6% |
| International Vanguard Total International Stock Index |
9.9% |
15.5% |
| Emerging Markets Vanguard FTSE Emerging Markets ETF |
7.1% |
9.3% |
| US REITs Vanguard Real Estate Index |
18.2% |
11.8% |
| Investment-Grade Bonds iShares Core Total U.S. Bond Market ETF |
6.8% |
5.7% |
Individual Asset Classes
The returns for the recent quarter that are listed below are sourced from my.Dimensional.com.
US Stocks
The US equity market posted positive returns for the quarter and outperformed both non-US developed and emerging markets. Value underperformed growth within large caps and outperformed within small caps. Small caps outperformed large caps. REIT indices outperformed equity market indices.
International Developed Market Stocks
Developed markets outside of the US posted positive returns for the quarter and underperformed the US market, but outperformed emerging markets. Value underperformed growth. Small caps outperformed large caps.
Emerging Markets Stocks
Emerging markets posted positive returns for the quarter and underperformed both US and non-US developed markets. Value outperformed growth. Small caps outperformed large caps.
Real Estate Investment Trusts
US real estate investment trusts outperformed non-US REITs during the quarter.
Fixed Income
Interest rates generally decreased in the US Treasury market for the quarter.
On the short end of the yield curve, the 1-Month US Treasury Bill yield increased 5 basis points (bps) to 5.60%, while the 1-Year US Treasury Bill yield decreased 67 bps to 4.79%. The yield on the 2-Year US Treasury Note decreased 80 bps to 4.23%.
The yield on the 5-Year US Treasury Note decreased 76 bps to 3.84%. The yield on the 10-Year US Treasury Note decreased 71 bps to 3.88%. The yield on the 30-Year US Treasury Bond decreased 70 bps to 4.03%.
In terms of total returns, short-term US treasury bonds returned 3.21% while intermediate-term US treasury bonds returned 3.99%. Short-term corporate bonds returned 4.12% and intermediate-term corporate bonds returned 5.86%.1
The total returns for short- and intermediate-term municipal bonds were 3.53% and 6.53%, respectively. Within the municipal fixed income market, general obligation bonds returned 7.79% while revenue bonds returned 8.15%.2
Conclusion
We continue to recommend an asset allocation for our clients based upon personal risk tolerance and long-term objectives. A mix with a larger allocation to stock is considered riskier but has a higher expected return over time.
Thank you for your continued confidence and trust.
Footnotes
- Bloomberg US Treasury and US Corporate Bond Indices.
- Bloomberg Municipal Bond Index.